Proksee News
A new tool has been added to Proksee:
Genome Identity Matrix
- Compare two or more complete or draft microbial genome assemblies with FastANI.
- Explore directional average nucleotide identity (ANI), distance, and alignment-fraction matrices.
- Group similar genomes with average-linkage clustering and matching dendrograms.
- Inspect FastANI fragment mappings for individual query–reference comparisons.
- Download matrix tables, figures, pairwise views, and summary metadata for downstream review.
FastANI was developed by Chirag Jain and colleagues for fast, whole-genome ANI estimation. The method and its large-scale application are described in their Nature Communications paper, High throughput ANI analysis of 90K prokaryotic genomes reveals clear species boundaries.
Genome Identity Matrix packages all directional FastANI comparisons into one interactive report. Users can switch among ANI, distance, and alignment fraction; view genomes in input or clustered order; add dendrograms; search genome labels; and inspect exact values for each query–reference cell. The displayed matrix can be exported as SVG, PNG, or ordered CSV.
The examples below use the tool's five-genome diagnostic data set. The 600 kb assembly, close_a, and close_b genomes produce dense collinear mappings. The 600 kb rearranged genome retains sixteen 30 kb blocks in a changed order, mixes in four unrelated blocks, and is stored as twenty FASTA records. The distant genome provides comparisons for which FastANI reports no value.
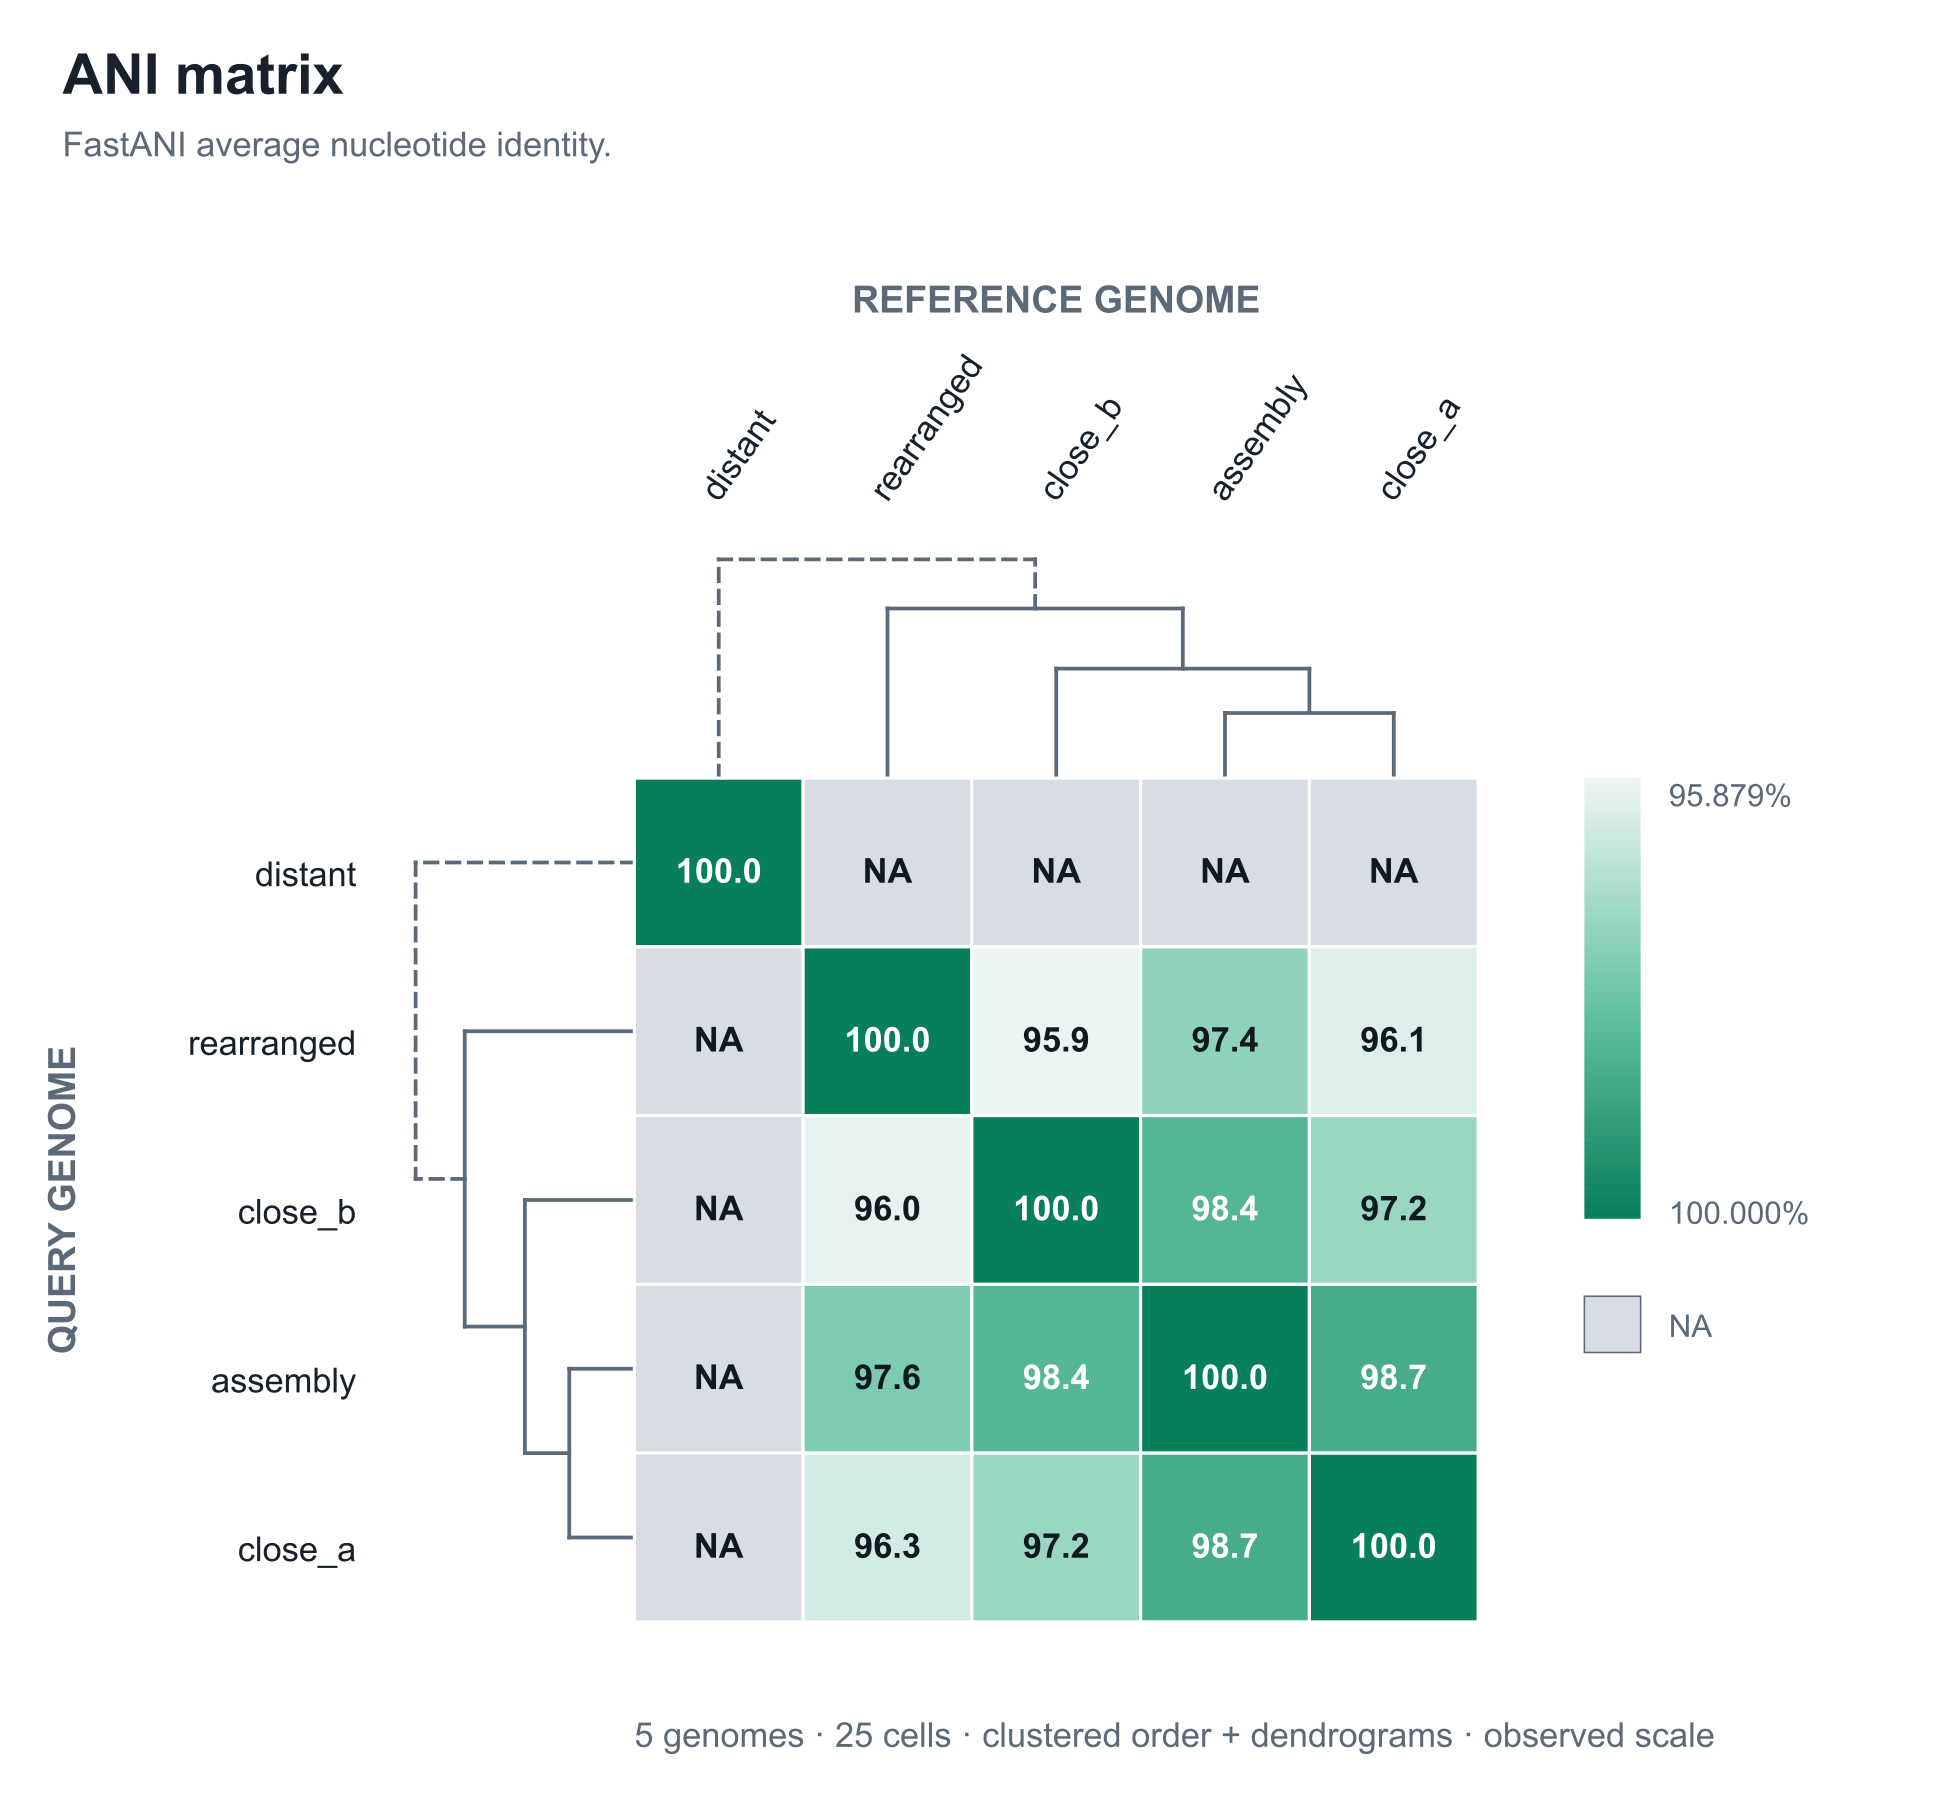
The dendrograms use average-linkage clustering on 100 − ANI, combining available results from both comparison directions. Solid joins are supported by FastANI distances; dashed joins indicate that no FastANI value was available between the connected clusters.
Selecting a matrix cell opens its directional FastANI fragment-mapping view. The reference genome is shown on top and the query genome below on one shared base-pair scale. A reference-position colour is copied to each linked query block, so smooth colour order supports conserved placement while reordered colours and crossing ribbons reveal changed sequence order or placement. Uncoloured intervals lack a plotted FastANI mapping, and darker ribbons represent higher fragment identity.
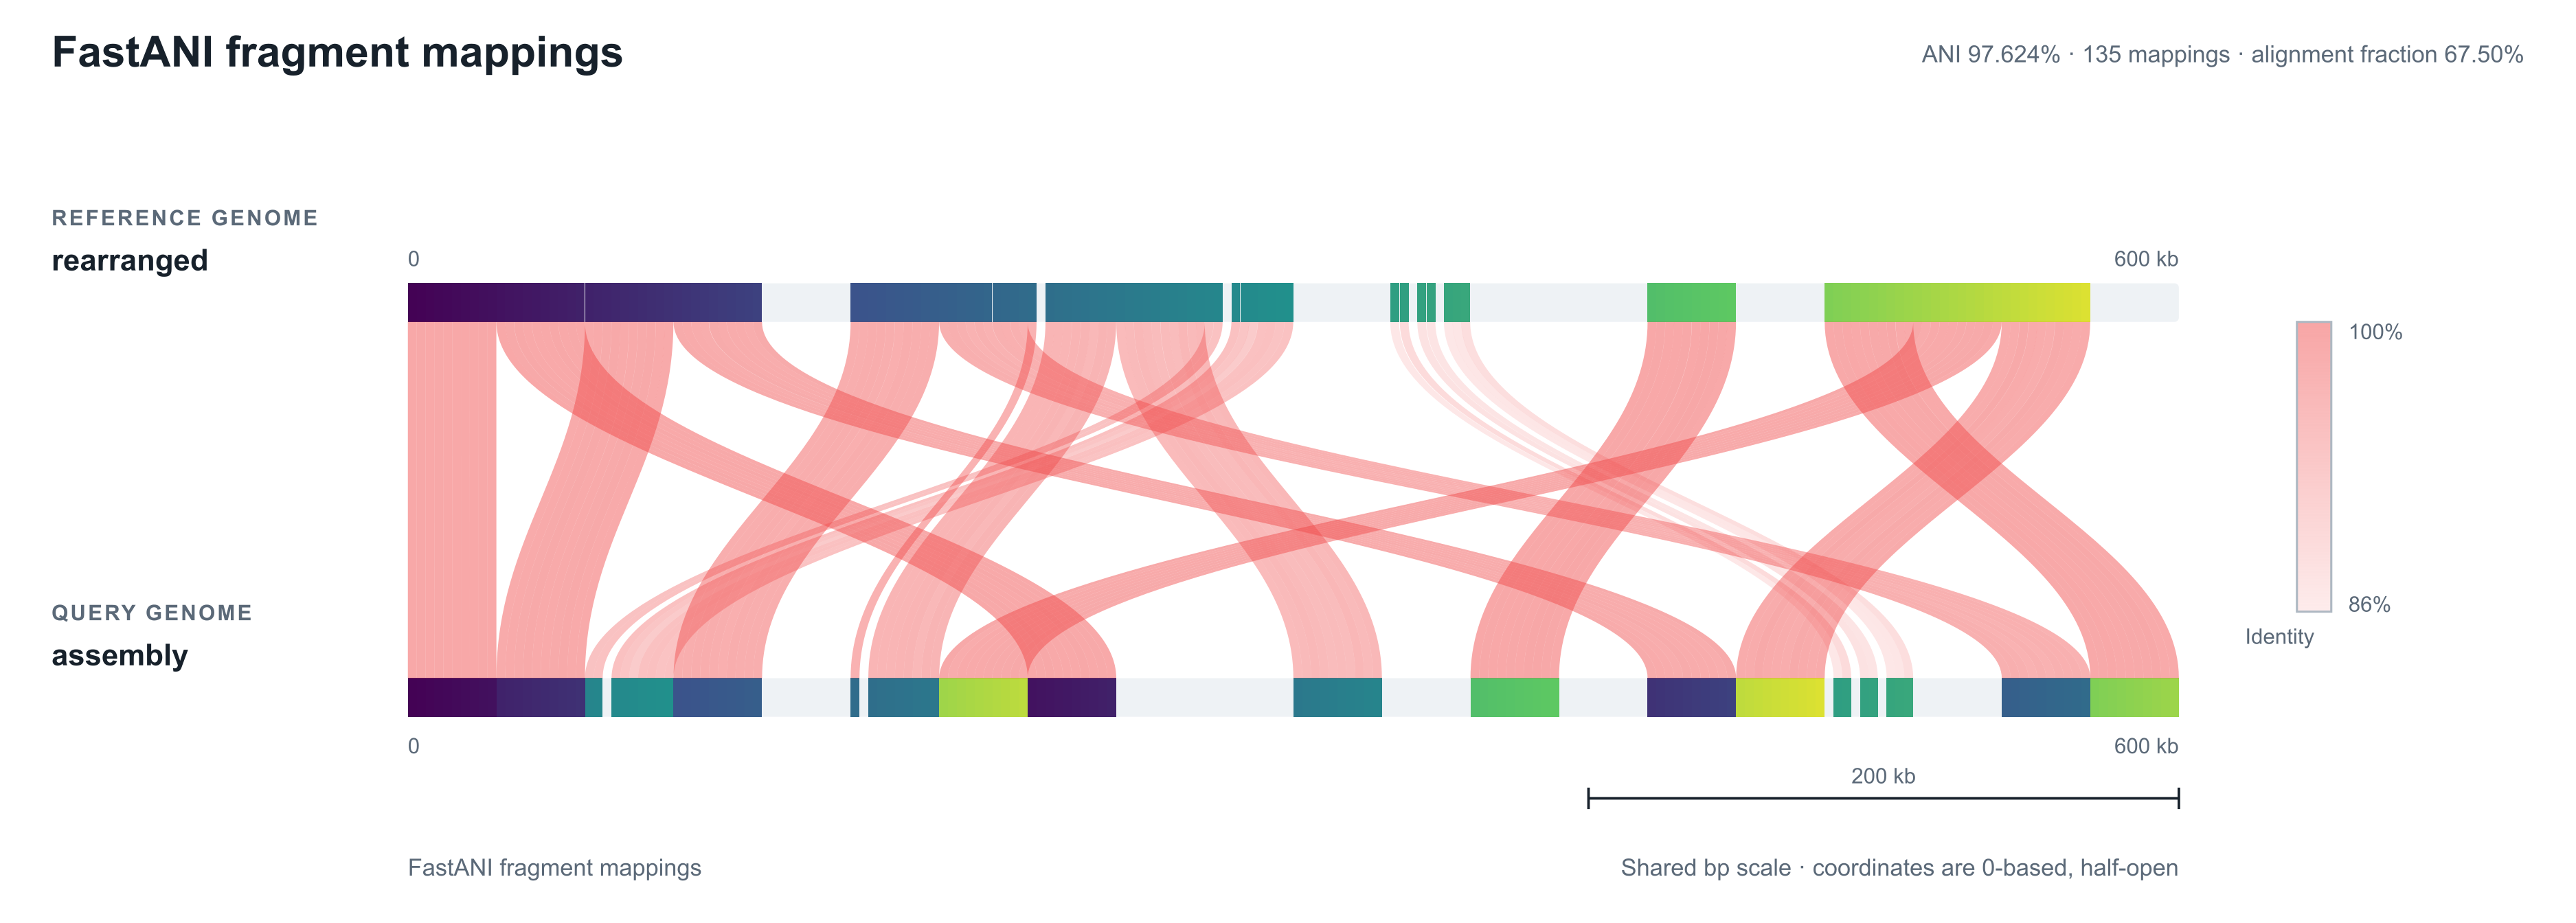
Genome Identity Matrix runs FastANI separately in both directions for every genome pair. The two results remain visible in opposite matrix cells and in separate pairwise views; the displayed ANI and alignment fraction values are not averaged. Because alignment fraction is calculated relative to the query genome, the two directions can differ. Fragmented-assembly record order can also create rearrangement-like mapping patterns, and FastANI's visual output does not report strand, so unexpected patterns are best followed with more detailed analysis.